


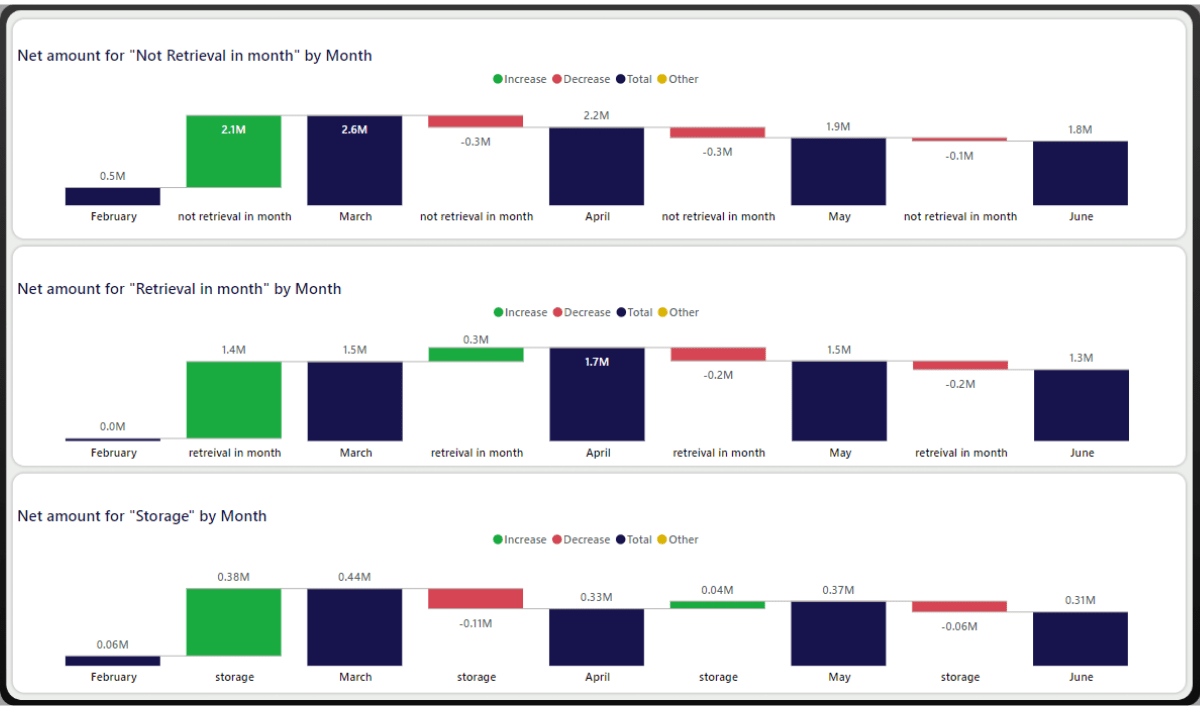
Growth/Decline by Service
This section showed a matrix showing how the client's insurance service (categorized further), this helped user experienced to judge the individual categories showing growth or decline.

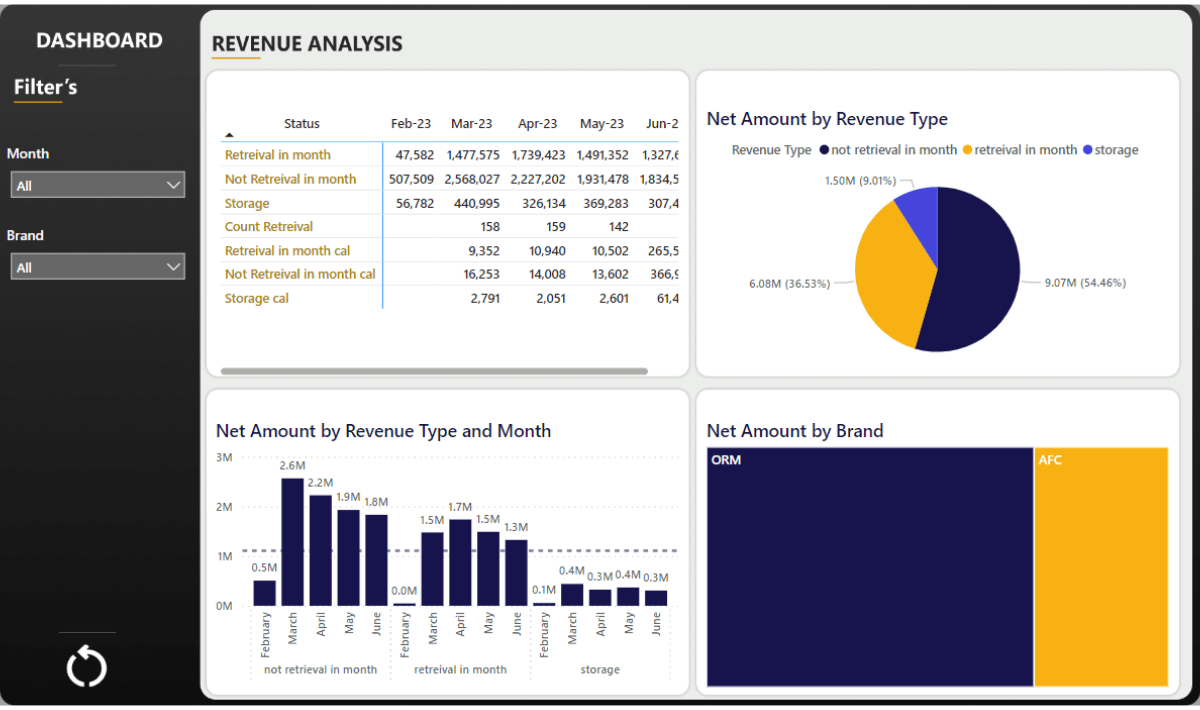
Product Analysis
Using bookmarks, we helped users to switch seamlessly between product and service breakdowns, providing a comprehensive view.


Power BI

DAX