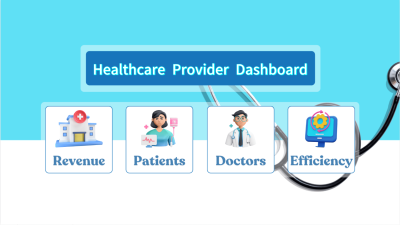
Transforming Healthcare Insights with Power BI
Objective to centralize patient, provider, billing, and operational data into a dynamic Power BI dashboard that supports smarter decisions, improves service delivery, and enhances financial and operational performance in healthcare facilities.

Challenge
The client is a multi-specialty healthcare provider operating in USA. With large volumes of patient records, provider performance data, and billing transactions, they needed a unified solution to analyze and interpret their healthcare metrics efficiently. Their goal was to move beyond spreadsheets and static reports to a more interactive and insightful analytics platform.
Siloed data across departments (patients, doctors, finance, operations).
Limited visibility into key performance indicators (KPIs) affecting patient care and revenue
Inability to track and improve operational efficiency (e.g., room utilization, length of stay).
No real-time view of billing patterns or payment status.
Lack of actionable insights to support data-driven planning
Our Solution
We developed an end-to-end Power BI dashboard tailored to healthcare KPIs, offering:
Patient Analytics
Tracked engagement, satisfaction, visit types, and follow-up trends
Provider Performance
Measured KPIs such as revenue contribution, treatment outcomes, and caseloads
Billing Intelligence
Visualized total billing by department, diagnosis, procedure, time, and location
Operational Efficiency
Assessed room occupancy, length of stay, treatment cost, and payment status
Insights & Recommendations
Delivered automated narratives and flags for decision-makers
Impact & Outcome
45% reduction in time spent on manual reporting
Clear identification of underperforming departments and cost leakage areas
Improved patient satisfaction tracking and response strategies
Optimized use of hospital resources (rooms and staff)
Real-time monitoring of revenue and outstanding payments
Greater alignment of performance with SDG 3 healthcare goals
Report / Screenshots
Interect with the live dashboard below.
Technology Stack
- Power BI Desktop & Service – Dashboard creation, sharing, and automation
- DAX (Data Analysis Expressions) – KPI calculations and logic
- Power Query – Data transformation and ETL processes
- MySQL Ser – Raw data source integration
Ready to unlock similar success for your organization?
Let’s discuss how we can help you achieve similar results with a custom Power BI solution.
