Unveiling Sales Potential with Power BI: A Case Study

Challenge
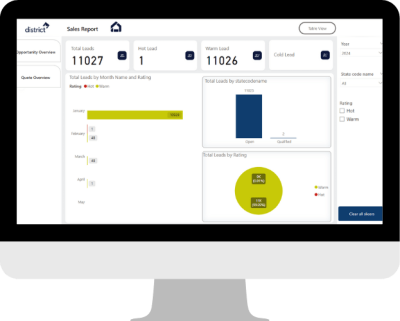
The client needed a clear picture of their sales pipeline, to see the data related to Sales in three sections:
1) Actual Sales Happened
2) Opportunities (which can be converted to sales)
3) Leads (which can be converted to opportunities)
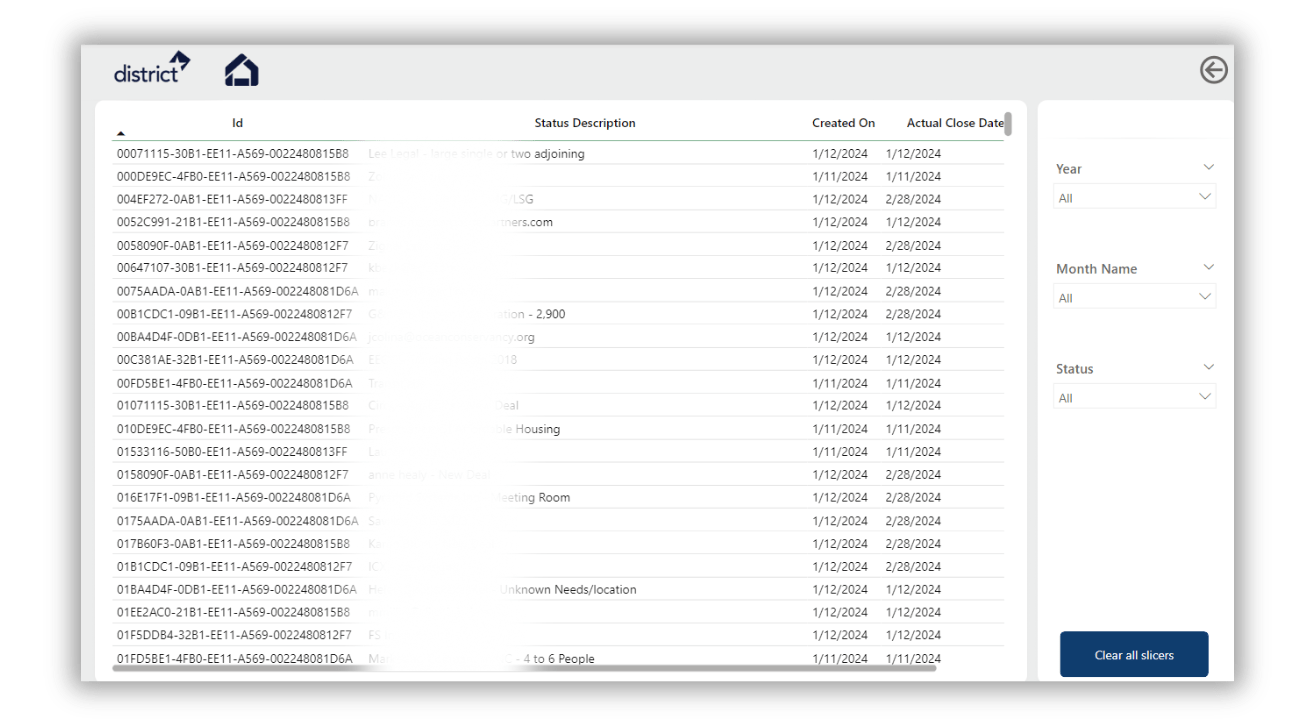
Along with that, the client also wanted that once users feel a specific thing needs to be changed, they can go to CRM to a specific account and change details over there.
Solution Delivered

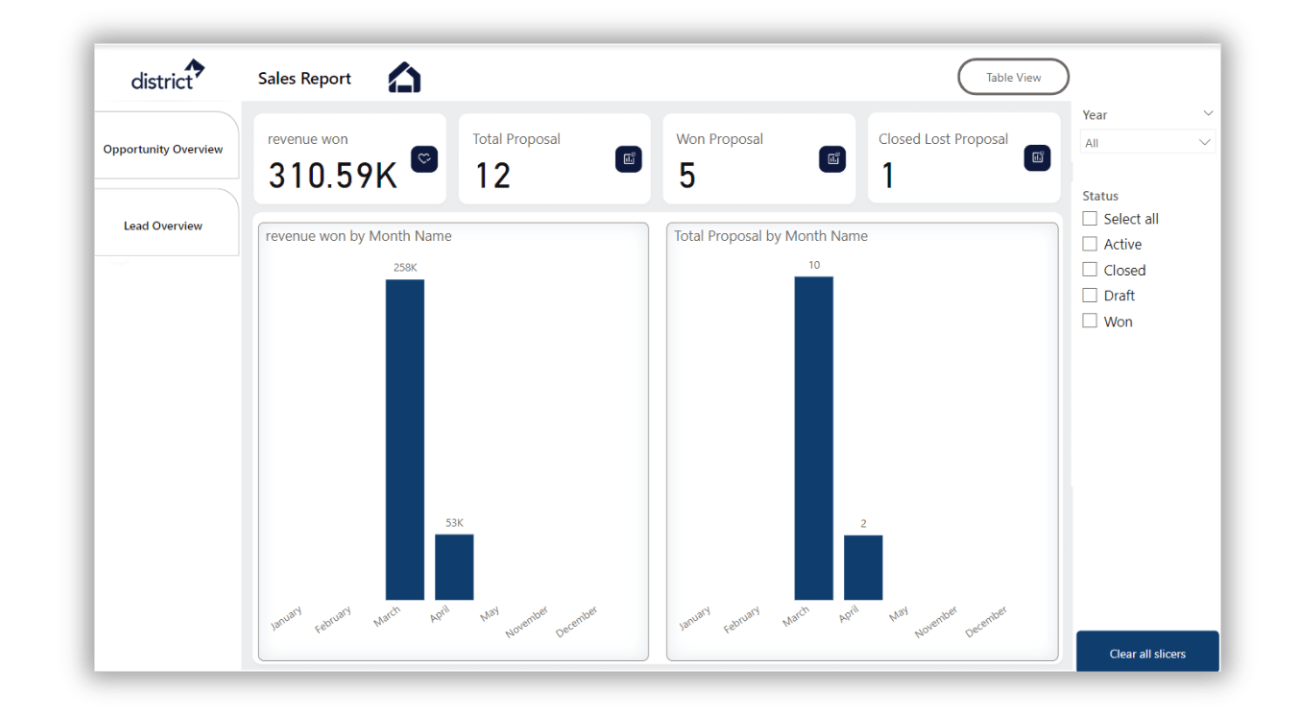
Sales Performance
Here, we show the total revenue generated, the total proposals sent, and the total deals won and lost. This section provides insight into trends by providing a monthly breakdown of revenue and proposals.

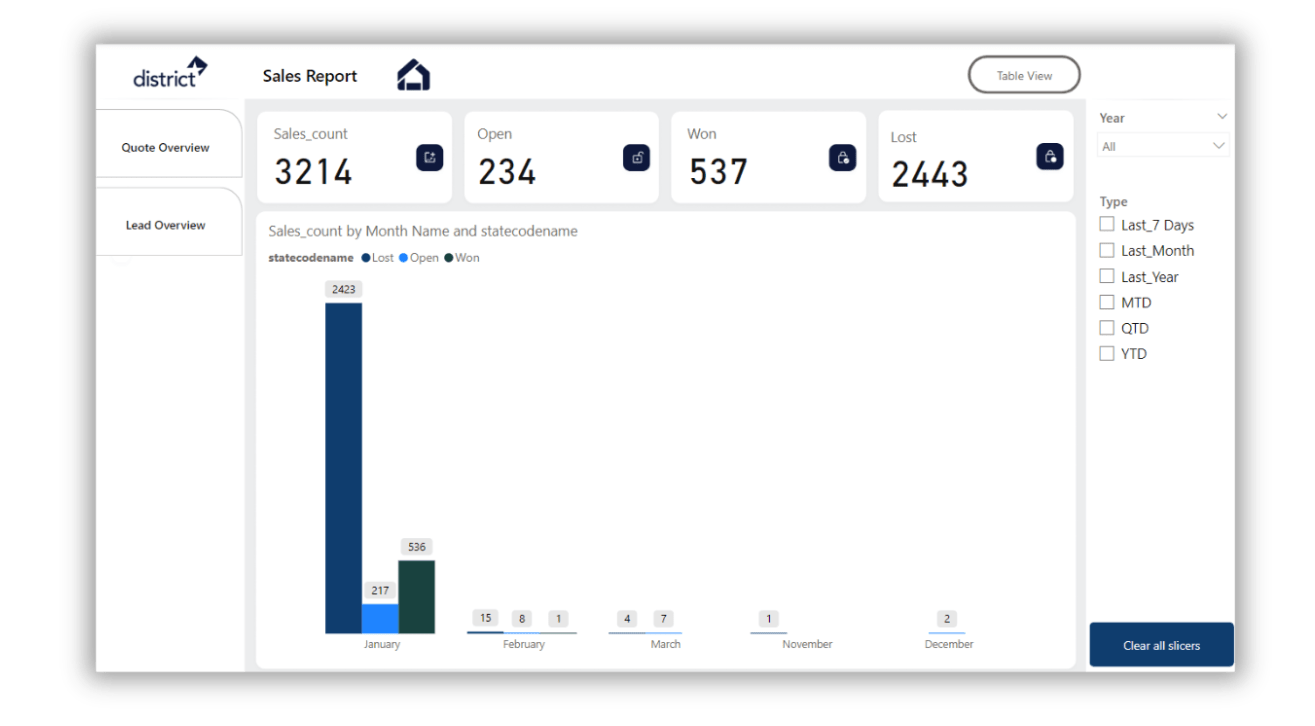
Opportunity Pipeline
Here, we focused on potential sales (which were basically leads that have a possibility of getting converted to sales). We categorized them as "Open," "Won," and "Lost," and displayed their monthly distribution to track progress or identify areas that need improvement.

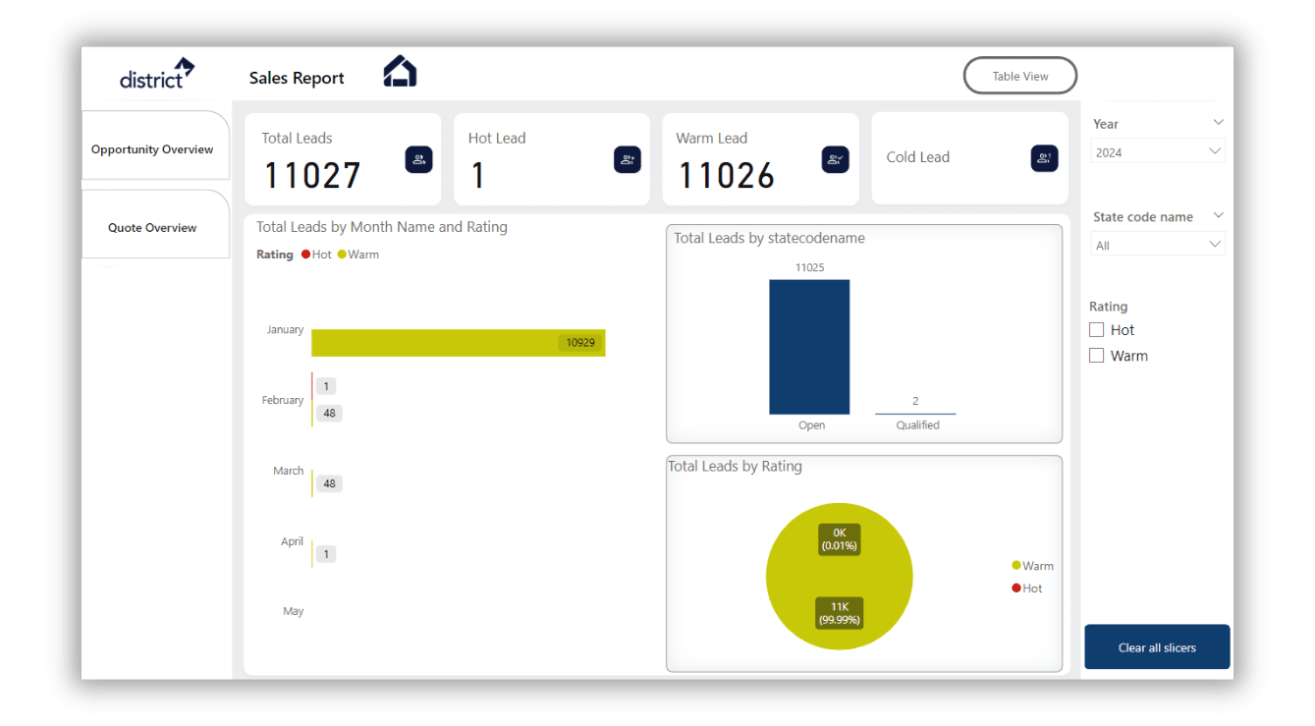
Lead Generation
This section tracked all leads, classifying them as "Hot," "Warm," and "Cold" leads. We furthermore displayed the monthly distribution of leads based on their rating, helping the client understand how their lead-generation efforts were performing.
Value Delivered
The key to this project was creating a seamless connection between Power BI reports and the client’s CRM system. We provided the client with a comprehensive one-stop solution wherein first through the report client can see the different status of sales (opportunities, leads, actual sales), and if required to further analyze, the client can click the link, go to CRM, and change it over there.


Tools Used

Power BI

DAX
Ready to unlock similar success for your organization?
Explore our Power Platform services and discover how we can help you achieve your business goals. Contact Us today for a free consultation!
